Featured

Carbon Lock-in in Norway: The Role of the Petroleum-Institutional Complex

Introduction

Unruh (2000) defined “carbon lock-in” as an industrial economy that perpetuates the use of fossil fuels due to the co-evolution and interdependence of technical systems, institutions and society (Technical-Institutional Complex). This promotes through mutual self-interest the status quo and inhibits the introduction of alternatives to fossil fuels. Seto et al. (2016) describes three types of carbon lock-in: infrastructural & technological, institutional and behavioural and are summarised in Table 1. 

Table 1 Summary of the three types of carbon lock-in and their characteristics (Setons et al., 2016)

For detailed description of the concept of carbon lock-in resulting from the Technical Institutional Complex the reader is referred to Unruh (2000), Unruh (2002) and Seto et al. (2016). 

This briefing will explain how wealth generated by the Norwegian oil & gas (O&G) sector has led to carbon lock-in and how continued extraction of O&G is now a barrier to low-carbon business. The term “Petroleum-Institutional Complex” (PIC) is introduced. 

Background

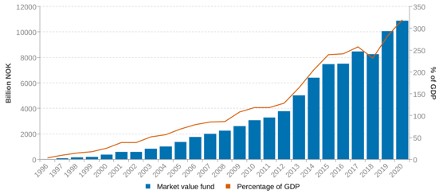
The discovery of the Ekofisk field in 1969 started the Norwegian O&G sector. Today, Norway is the world´s 15th largest oil and 3rd largest gas exporter representing ~2% and ~3% of global output respectively (Norwegian Petroleum, 2021a). Macro-economically, the sector accounts for 36% of exports, 10% of State revenues (GBP ~8.6 billion), 12% of GDP, 18% of total investments and employs, directly or indirectly, ~225,000 people (Norwegian Petroleum, 2021c, NPD, 2021b). Revenue from Norway´s O&G sector is a key part of fiscal policy underpinning State finances and is the basis for a sovereign wealth fund (SWF) worth GBP ~1 trillion or GBP 175k per registered person in Norway (Norwegian Petroleum, 2021d); Figure 1.

Figure 1 Market Value of Norwegian Sovereign Wealth Fund 1996 -2020 (Norwegian Petroleum, 2021d)

Norway has green credentials: 98% of domestic electricity generation is from renewables (Energy-Facts-Norway, 2021), domestic heating is from electricity and electric vehicle sales account for >50% of market share (Reuters, 2021). With respect to the O&G sector, Norway has a CO2 tax (1991) and EU-ETS (2007) making it the second most taxed sector in Norway after aviation (NPD, 2021b).

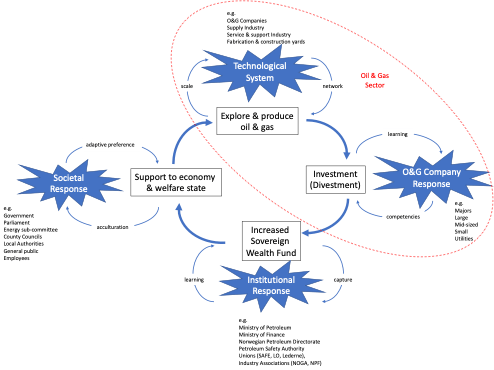
The Ministry of Petroleum & Energy (MPE) is responsible for policy/regulatory framework and the Norwegian Petroleum Directorate (NPD) has oversight for optimum resource management. Both Equinor and Petoro, large Norwegian O&G companies report to the MPE (the State being the majority owner); see Figure 2 for the organogram of Norwegian State institutions responsible for policy-making, regulation and oversight. 

Figure 2 State organisation of petroleum activities. Those circled red are referred to in this assignment. Taken from Norwegian Petroleum (2021f)

These institutions evolved in parallel with the O&G sector (Figure 3) with the founding principle to maximise value from the O&G sector for Norwegian society in a long-term perspective (Norwegian Petroleum, 2021b). Recently, however, following significant losses in Equinor´s business unit responsible for the USA (Adomaitis, 2021), oversight of Equinor, Petoro and SDFI[1] has been moved from the MPE to the Ministry of Trade, Industry and Fisheries (Nilsen et al., 2021) to address any potential conflicts of interest.

O&G companies pay 78% tax comprising company tax (22%) and special petroleum tax (56%); subsidies to incentivise investment include tax on net profit only with losses carried forward, short depreciation (6-years) with uplift and an exploration refund (Norwegian Petroleum, 2021e). The philosophy is for a neutral tax system that shares the risk/reward between companies and the State, maximising value creation for society and providing a predictable but not excessive rate of return for O&G companies (Osmundsen, 1999). In addition, policies limiting annual expenditure from the SWF to 3% of interest earnt has ensured that Norway has not suffered from the “resource curse” as seen in other countries (Holden, 2013).

Figure 3 Timeline of Norwegian O&G Sector and production Profile (NPD, 2021c)

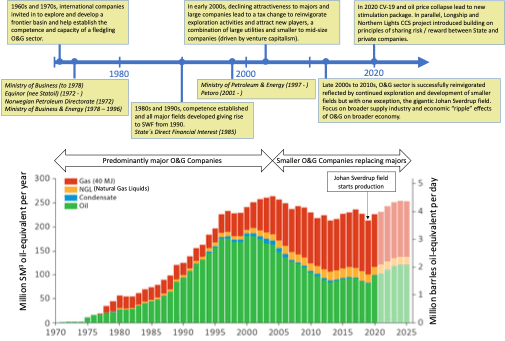
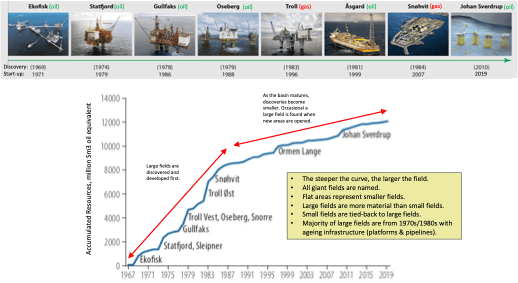
Thirty-nine O&G companies are currently active in Norway (NPD, 2021c). In 2004, a tax refund was introduced to revive exploration; companies only pay 22% of exploration costs and receive a 78% tax refund on the rest (NPD, 2021b). This change boosted the number of smaller companies and since 2004, these have replaced the large international O&G companies (majors); recent consolidation has given rise to medium-sized Norway-focussed companies (Figure 4). This transition reflects the creaming curve of O&G basins, where the largest most material fields are discovered first and thereafter materiality decreases as fields get smaller; smaller fields are less attractive to the majors who have higher internal rate of return hurdles compared to smaller companies (NPD, 2021b); Figure 5. 

Figure 4 O&G Company sizes in Norway (NPD, 2021c)
Figure 5 Cumulative Petroleum Resource Creaming-Curve for Norway (NPD, 2021b)

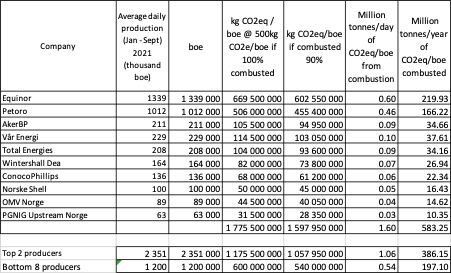
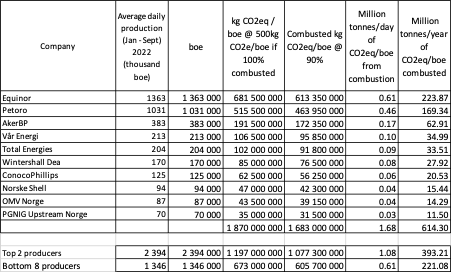
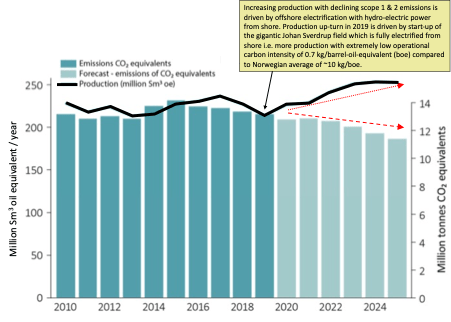
Emissions-wise, the O&G sector emitted ~13 Mt CO2e in 2019 and is the single largest source (28%) (Statistics Norway, 2020). The O&G sector plans to reduce operational carbon through increased efficiency and electrification of facilities with a goal to reduce from 13.7 to 6.75 Mt CO2e by 2030 (KonKraft, 2021); Figure 6. However, only scope 1 & 2 emissions are included while scope 3 emissions from exported O&G are not and amounted to ~677 Mt CO2e for 2020 assuming ~1.425 billion boe[1] exported in 2020 (Norwegian Petroleum, 2021a) @ 475kg CO2e/boe (Gordon and Feldman, 2016).

Figure 6 Norwegian Production versus Emissions (NPD, 2021c, Equinor, 2020)

[1] Barrel-of-oil-equivalent

Barrier to a low-carbon future

Norway´s wealth is synonymous with the O&G sector (Norwegian Petroleum, 2021d). Early policies secured high income to the State, protected Norway from the “resource curse” and generated the world´s largest SWF. However, it is proposed that this success now impedes transition to a low-carbon economy as the incumbent PIC (O&G sector, government and societal institutions) is now locked into continued O&G production as it is a source of wealth for Norway (Figure 7).

Government policies in the 1960´s/1970´s shared the risk/reward in order to attract the majors to develop O&G resources and help establish technical competence and capability in Norway. As the sector matured in the 1980s/1990s, these policies were retained to address the cyclical (boom & bust) nature of the industry created by oil price volatility (Dahl et al., 2017) and temporarily updated in response to the Covid-19 pandemic (Reuters, 2020, Norwegian Petroleum, 2021e). It is inferred that declining materiality and the transition from the majors to smaller companies has reinforced the need to maintain tax subsidies; smaller companies lack the financial strength of the majors and require tax subsidies (lower costs) to secure funding from venture capitalists and banks (Venables, 2018, IEA, 2020). 

Figure 7 Petro-Institutional Complex in Norway highlighting interdependencies between Technological System, O&G Companies, Institutions and Society that reinforce the dominance the O&G sector. After Unruh (2000).

The NPD, whose role is to maximise value creation from O&G extraction, actively promote exploration to offset declining production and recently stated that only 50% of O&G resources have been discovered and extracted to date (NPD, 2021a). This has created “exploration-only” companies attracted by the exploration tax refund and sustains technological and institutional lock-in of the PIC. Infrastructural lock-in has also arisen because existing O&G facilities are ageing and timely exploration is required to maximise O&G extraction and value creation before these facilities can no longer be used; smaller fields cannot support stand-alone capital investment. This lock-in is further reinforced by the fear of stranded assets, especially for smaller companies and their investors (Livsey, 2020).

The PIC narrative, dominated by references to value creation, long-term future, employment opportunities and economic ripple-effects, also presents “green” credentials of low operational carbon intensities for scopes 1 & 2 (KonKraft, 2020, KonKraft, 2021). The MPE have influenced these low-carbon efforts with policies that push for electrification of facilities (NPD, 2020) and state that continued extraction is justified to avoid carbon leakage to countries with higher carbon intensities perpetuating lock-in (NPD, 2021b). However, scope 3 emissions of exported O&G and the broader climatic implications are conveniently overlooked.

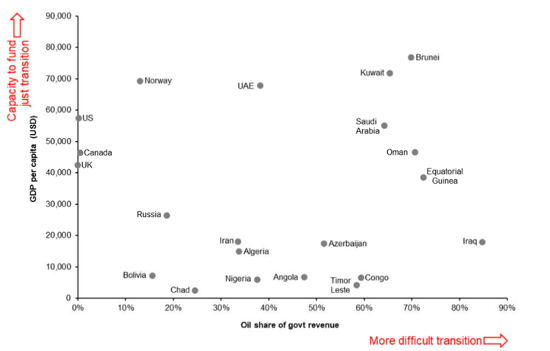
Fæhn et al. (2017), McKinnon et al. (2017) and Holtsmark (2019) propose that Norway is well placed to implement supply-side policies that could reduce scope 3 emissions. Muttitt & Kartha (2020) demonstrate that Norway is well positioned to play a leading role in a just energy transition with a high GDP per capita and low percentage of the share of government revenue coming from oil (Figure 8). Aune et al. (2020) highlight that stopping exploration activities in Norway, similar to other countries (Piggot et al., 2018), will have limited macro-economic impact due to a declining creaming-curve. Yet the NPD actively promotes the remaining resource potential (NPD, 2021b). Both Pye et al. (2020)and Pellegrini et al. (2021) discuss the need for equitable solutions for keeping unburnable O&G in the ground to limit global warming through supply-side policies. Norway, with its SWF, is ideally placed to lead, however, domestic policies are restricted to the demand-side (e.g. COtax) to avoid the issue of market turmoil and vulnerability of smaller companies to stranded assets (Chevallier et al., 2021). It is ironic that the SWF was advised in 2018 to divest from O&G investments for this reason (Van der Ploeg, 2018) and did so by end 2020 (Arvin, 2021b).

Figure 8. GDP per capita versus oil share in government revenue (Taken from Mutti & Kartha 2020)

Vergragt et al. (2011) argue that carbon capture and storage (CCS) reinforces fossil fuel lock-in and is perhaps epitomised by the Northern Lights part of the Longship CCS project: the objective to demonstrate commercial feasibility of sequestrating industrially-sourced CO2 using existing Norwegian O&G CCS experience (MPE, 2020). 

Northern Lights is the storage element and mirrors the O&G sector in the 1970s; risk/reward is shared between the State and participating companies with the MPE/NPD responsible for regulation/oversight. The project makes use of existing competence in the O&G sector which is attractive to O&G employees, suppliers and unions. However, all these participants advocate continued extraction of O&G and cynically, CCS outwardly solves/distracts from the issue of scope 3 emissions. This can be explained as the PIC´s inbuilt response to maintain the system for mutual benefit by developing common interests to allow continued O&G extraction (Unruh, 2000, Seto et al., 2016). Arvin (2021a) proposes that separation of economic from climate policies is the cause i.e. the O&G economy that underpins policy has successfully externalised the impact of scope 3 emissions whilst promoting reductions in scopes 1 & 2 and carbon leakage to justify continued extraction. 

Summary

Kenner and Heede (2021) leave no doubt that O&G companies will not lead efforts to decarbonise and draw similar conclusions to Abreu et al. (2020) in that policy makers will need to take the lead. However, it is argued that Norwegian policy-makers are impeded by carbon lock-in from the PIC which now act as a barrier to low-carbon business.

Unruh (2002) states that external factors are required to help policy-makers escape from carbon lock-in. Norway has avoided the “resource curse” but is now affected by “resource inertia” and given the low interest in the energy transition from the general public (Tvinnereim et al., 2020), policy-maker procrastination towards low-carbon business will continue.

References

ABREU, M. C. S. D., WEBB, K., ARAÚJO, F. S. M. & CAVALCANTE, J. P. L. 2020. From “business as usual” to tackling climate change: Exploring factors affecting low-carbon decision-making in the Canadian oil and gas sector. Energy Policy,148.

ADOMAITIS, N. 2021. Equinor sells U.S. Bakken shale assets, posts record loss for 2020 | Reuters [Online]. https://www.reuters.com/article/us-equinor-usa-idUSKBN2AA0FX: Reuters.  [Accessed 10th February 2021].

ARVIN, J. 2021a. How Norway’s oil and gas legacy complicates its climate change leadership. VOX [Online]. Available: https://www.vox.com/22227063/norway-oil-gas-climate-change [Accessed 20th February 2021].

ARVIN, J. 2021b. Norway’s trillion-dollar wealth fund sold the last of its investments in fossil fuel companies. VOX [Online]. Available: https://www.vox.com/22256192/norway-oil-gas-investments-fossil-fuel [Accessed 20th May 2021].

AUNE, F. R., CAPPELAN, Å. & MÆLAND, S. 2020. Konsekvenser av redusert petroleumsvirksomhet (Consequences of Reduced Petroleum Activity). Statistisk sentralbyrå.

CHEVALLIER, J., GOUTTE, S., JI, Q. & GUESMI, K. 2021. Green finance and the restructuring of the oil-gas-coal business model under carbon asset stranding constraints. Energy Policy, 149.

DAHL, R. E., LORENTZEN, S., OGLEND, A. & OSMUNDSEN, P. 2017. Pro-cyclical petroleum investments and cost overruns in Norway. Energy Policy, 100, 68-78.

ENERGY-FACTS-NORWAY. 2021. Electricity Production [Online]. Available: https://energifaktanorge.no/en/norsk-energiforsyning/kraftproduksjon/ [Accessed 30th April 2021].

EQUINOR 2020. Equinor Business Update December 2020. Equinor ASA.

FÆHN, T., HAGAN, C., LINDHOLT, L., MÆLAND, S. & ROSENDAHL, K. E. 2017. Climate Policies in a Fossil Fuel Producing Country: Demand versus Supply Side Policies. The Energy Journal, 38, 77-102.

GORDON, D. & FELDMAN, J. 2016. Breaking Down the Barrel: Tracing GH Emissions Through the Oil Supply Chain [Online]. Carnegie: Endowment For International Peace. Available: https://carnegieendowment.org/2016/02/09/breaking-down-barrel-tracing-ghg-emissions-through-oil-supply-chain-pub-62722 [Accessed 6th March 2021].

HOLDEN, S. 2013. Avoiding the resource curse the case Norway. Energy Policy, 63, 870-876.

HOLTSMARK, K. 2019. Supply-side Climate Policy in Norway. Nordic Economic Policy Review, 12, 209-235.

IEA 2020. World Energy Investment 2020. https://iea.blob.core.windows.net/assets/ef8ffa01-9958-49f5-9b3b-7842e30f6177/WEI2020.pdf: International Energy Agency.

KENNER, D. & HEEDE, R. 2021. White knights, or horsemen of the apocalypse? Prospects for Big Oil to align emissions with a 1.5 °C pathway. Energy Research & Social Science, In Press.

KONKRAFT 2020. The Energy Industry of Tomorrow on the Norwegian Continental Shelf: Climate Strategy Towards 2030 and 2050. KonKraft.

KONKRAFT 2021. Framtidens Energinæring på norsk sokkel: Klimastrategi mot 2030 og 2050  Statusrapport 2021. KonKraft rapport 2021-2. KonKraft.

LIVSEY, A. 2020. Lex in depth: the $900bn cost of ‘stranded energy assets’. Financial Times, 4th February 2020 

MUTTITT, G & Kartha, S. 2020. Equity, Climate Justice and Fossil Fuel Extraction: principles for a managed phase out. Climate Policy, 20:8, 1024-1042, DOI: 10.1080/14693062.2020.1763900.

MCKINNON, H., MUTTITT, G. & TROUT, K. 2017. The Sky´s Limit Norway – Why Norway should lead the way in a managed decline of oil and gas extraction. http://priceofoil.org/2017/08/09/the-skys-limit-norway-why-norway-should-lead-the-way-in-a-managed-decline-of-oil-and-gas-extraction/: Oil Change International.

MPE 2020. Longship – Carbon capture and storage. Med. St 33 (2019-2020) Report to Storting (white paper). Norwegian Ministry of Petroleum and Energy.

NILSEN, A. A., BOE, E. & LORENTZEN, M. 2021. Regjeringen flytter Equinor og Petoro til Næringsdepartementet: – Har jobbet med dette i over ett år [Online]. https://e24.no/boers-og-finans/i/6zmOVO/regjeringen-flytter-equinor-og-petoro-til-naeringsdepartementet-har-jobbet-med-dette-i-over-ett-aar: E24.  [Accessed 23rd June 2021].

NORWEGIAN PETROLEUM. 2021a. Exports of Norwegian oil and gas [Online]. Available: https://www.norskpetroleum.no/en/production-and-exports/exports-of-oil-and-gas/ [Accessed 26th April 2021].

NORWEGIAN PETROLEUM. 2021b. Fundamental regulatory principles [Online]. Available: https://www.norskpetroleum.no/en/framework/fundamental-regulatory-principles/ [Accessed 6th May 2021].

NORWEGIAN PETROLEUM. 2021c. The government’s revenues [Online]. Available: https://www.norskpetroleum.no/en/economy/governments-revenues/ [Accessed 26th April 2021].

NORWEGIAN PETROLEUM. 2021d. Management of Revenues [Online]. Available: https://www.norskpetroleum.no/en/economy/management-of-revenues/ [Accessed 30th April 2021].

NORWEGIAN PETROLEUM. 2021e. The Petroleum Tax System [Online]. Available: https://www.norskpetroleum.no/en/economy/petroleum-tax/ [Accessed 26th April 2021].

NORWEGIAN PETROLEUM. 2021f. State organisation of Petroleum Activities [Online].https://www.norskpetroleum.no/en/framework/state-organisation-of-petroleum-activites/.  [Accessed 10th May 2021].

NPD 2020. Power From Shore to the Norwegian shelf – Summary of report 2020. https://www.npd.no/en/facts/publications/reports2/report-archive/Power-from-shore-to-the-Norwegian-shelf/: Norwegian Petroleum Directorate.

NPD. 2021a. Plenty of oil and gas left on the Norwegian shelf [Online]. https://www.theguardian.com/environment/2021/jan/05/electric-cars-record-market-share-norway. Available: https://www.npd.no/en/facts/news/general-news/2021/plenty-of-oil-and-gas-left-on-the-norwegian-shelf/[Accessed].

NPD 2021b. Resource Report 2020 Exploration. https://www.npd.no/en/facts/publications/reports2/resource-report/resource-report-2020/: Norwegian Petroleum Directorate.

NPD 2021c. The Shelf 2020. https://www.npd.no/globalassets/1-npd/publikasjoner/sokkelaret/sokkelaret-2020/theshelf-2020-presentation-english.pdf: Norwegian Petroleum Directorate.

OSMUNDSEN, P. 1999. Risk sharing and incentives in Norwegian petroleum extraction. Energy Policy, 27, 549-555.

PELLEGRINI, L., ARSEL, M., ORTA-MARTÍNEZ, M., MENA, C. F. & MUÑOA, G. 2021. Institutional mechanisms to keep unburnable fossil fuel reserves in the soil. Energy Policy, 149.

PIGGOT, G., ERICKSON, P., VAN ASSELT, H. & LAZARUS, M. 2018. Swimming upstream addressing fossil fuel supply under the UNFCCC. Climate Policy, 18:9, 1189-1202.

PYE, S., BRADLEY, S., HUGHES, N., PRICE, J., WELSBY, D. & EKINS, P. 2020. An equitable redistribution of unburnable carbon. Nature Communications, 11.

REUTERS. 2020. Norway parliament grants more tax relief to oil sector | Reuters [Online]. Available: https://www.reuters.com/article/us-health-coronavirus-norway-oil-idUSKBN23F1NV [Accessed 26th April 2021].

REUTERS. 2021. Electric cars rise to record 54% market share in Norway. The Guardian, 5th January 2021.

SETO, K. C., DAVIS, S. J., MITCEHLL, R. B., STOKES, E. C., UNRUH, G. C. & URGE-VORSTAZ, D. 2016. Carbon Lock-In: Types, Causes, and Policy Implications. Annual Review of Environment and Resources, 41, 425-452.

STATISTICS NORWAY. 2020. Emissions to Air [Online]. Statisk sentralbyrå: Statistics Norway. Available: https://www.ssb.no/en/klimagassn [Accessed 25th January 2021].

TVINNEREIM, E., LÆGREID, O. M. & FLØTTUM, K. 2020. Who cares about Norway’s energy transition? A survey experiment about citizen associations and petroleum. Energy Research & Social Science, 62.

UNRUH, G. C. 2000. Understanding carbon lock-in. Energy Policy, 28, 817-830.

UNRUH, G. C. 2002. Escaping carbon lock-in. Energy Policy, 30, 317-325.

VAN DER PLOEG, R. 2018. Climate and the risk of stranded assets: portfolio management in Norway. https://nettsteder.regjeringen.no/klimarisikoutvalget/files/2018/01/Ploeg_klimarisiko_17January2018.pdf: Norway Climate Risk Commission.

VENABLES, M. 2018. New Oil And Gas Entrants Need New Funding Sources [Online]. https://www.forbes.com/sites/markvenables/2018/11/26/new-oil-and-gas-entrants-need-new-funding-sources/?sh=17f87cb278be: Forbes.  [Accessed 10th May 2021].

VERGRAGT, P. J., MARKUSSON, N. & KARLSSON, H. 2011. Carbon capture and storage, bio-energy with carbon capture and storage, and the escape from the fossil-fuel lock-in. Global Enviromental Change, 21, 282-292.

Norway´s Top Ten Contributors to Global GHG Emissions

Stavanger Aftenblad recently published an article titled “Ten on top – The shelf´s biggest producers” (Vikingstad, 2022). The focus of the article was to highlight the top ten oil and gas producers in Norway for 2022 with no other reason than that. There was no mention of the climate crises or how the combustion of these produced volumes will contribute to it. 

Therefore, I thought it would be fun to add a climate change context and re-classify these as the top ten contributors to greenhouse gas (GHG) emissions created by the combustion of the oil and gas they produce. These emissions are classified as Scope 3 and this is something the petroleum industry and government  in Norway turn a blind eye to.  Primarily because the oil and gas is exported and not part of the GHG emissions reported by Norway. Norway promotes itself as a “low carbon intensity” oil and gas producer focusing on Scope 1 and 2 emissions only  and is a blatant smoke screen to justify continued production. The Norwegian Oil & Gas Association, renamed to Offshore Norge to greenwash its role in promoting continued oil and gas production, proudly emphasises this point with no mention of Scope 3 emissions (KonKraft, 2022). 

The main narratives by the petroleum industry and their supporters in Norway are:

  1. Wealth creation for Norway, 
  2. Oil and gas jobs and ripple effects, and 
  3. Energy security, 

The primary focus is to reduce Scope 1 and Scope 2 emissions to help Norway achieve its climate goals by reducing emissions related to extraction whilst the rest the world can pick up the cost for the Scope 3 emissions. That is not Norway´s problem.

Not all oil and gas that is produced and sold to the internal market  is combusted, some is used to make plastics, fertilisers and other items. This ranges from 7 to 10%  so  let’s be generous and say that only 90% of produced oil and gas is combusted (Francis, 2018, KonKraft, 2020, Vandenbussche and Rambach, 2019). So how much carbon comes from combusting a barrel of oil or barrel of oil & gas equivalent (boe) for gas. 

The average carbon dioxide coefficient of distillate fuel oil is 431.87 kg CO2 per 42-gallon barrel (EPA, 2022). The average carbon dioxide coefficient of liquefied petroleum gases is 235.7 kg CO2 per 42-gallon barrel (EPA, 2021).

If the GHG emissions are tracked through the oil supply chain of up- mid- and downstream, these values are proposed by Gordon and Feldman (2016). 

Oil typeTotal GHG Emissions (kg CO2eq./barrel crude)
Conventional light oil475
Depleted oil715
Light, gassy oil750
Extra heavy oil770
Example GHG emissions through the oil supply chain from extraction to final use

Alternatively, the OCI (2016) also provides Norway specific values.

FieldGHG Emissions (kg CO2eq./barrel crude)
Skarv487
Oseberg527
Ekofisk481

To keep the maths simple let´s assume an average barrel of oil produced in Norway produces a total of 500 Kg CO2eq. / boe. This may be a gross assumption as a lot of gas is produced by Norway however it has been converted into boe. The calculation does not take into consideration Scope 1 2021 (Statistics Norway, 2022)

So let´s do the maths and determine the Scope 3 emissions Norway´s top oil and gas are responsible for:

 Table 1. Scope 3 GHG emissions for Top Ten Producers in 2021
Table 2. Scope 3 GHG emissions for Top Ten Producers in 2022

It is interesting to observe that Equinor and Petoro owned by the Norwegian State at 78% and 100% respectively, account for close to double the emissions of the other top 8 companies combined. That means the Norwegian Government is responsible for the majority of Scope 3 emissions coming from the oil and gas produced and exported from the Norwegian Continental Shelf. Yet the same government promotes itself, rather hypocritically, as a leader on climate change by conveniently ignoring the scope 3 emissions. Why? Because it is in the thrall of the oil and gas lobby and who have convinced the government that it needs the tax revenues to balance the books with the mantras of value creation, jobs and energy security. Why kill the goose that lays the golden egg when scope 3 emissions are not Norway´s problem. 

Norway emitted 48.9 million tonnes of CO2eq. in 2021 (Statistics Norway, 2022) of which 12.1 million related to oil and gas extraction. That means that Norway exported close to 11.9 times its own GHG emissions in 2021. The increase in production in 2022 driven by the war in Ukraine shows this increased to 12.5 times its own GHG emissions assuming the same level of national emissions in 2022. Norway would have a real problem if it needed to deal with the Scope 3 emissions it is contributing towards. Why is this ignored?

The Government Pension Fund of Norway, specifically the The Government Pension Fund Global” also known as the “Oil Fund”, is worth some USD 1.3 trillion (end 2022 estimate) (NBIM, 2023).  

The Oil Fund  proudly claims “We work to safeguard and build financial wealth for future generations”. By future generations, I assume Norwegian ones, and as such, this is a big snub to put it lightly to all future generations in the global south who will suffer the most due to the impact of climate change! Yet ironically the Oil Fund itself no longer invest in oil and gas due to the detrimental impact of its activities (Arvin, 2021).

Despite this moratorium, the Norwegian government through the Ministry of Petroleum & Energy and the Norwegian Petroleum Directorate continue to push, promote and subsidise oil & gas production on the NCS to secure wealth for Norway at the expense of the rest of the world (NPD, 2023). It is hard to stop when you are addicted to something even when you have so much money available to transition away from oil and gas quicker than nations that don´t have such wealth. Takle (2020) highlights how the oil fund has migrated to represent value generation for Norway without consideration to the environmental consequences, and how this will impact the “wealth” of future generations. This is especially relevant as that future will be pretty bleak if global emissions of GHG are not significantly reduced as soon as possible.

This is a moral and ethical question more than anything else but is Norway ready to look itself in the mirror and ask it!

References

ARVIN, J. 2021. Norway’s trillion-dollar wealth fund sold the last of its investments in fossil fuel companies. VOX [Online]. Available: https://www.vox.com/22256192/norway-oil-gas-investments-fossil-fuel [Accessed 20th May 2021].

EPA 2021. Inventory of U.S. Greenhouse Gas Emissions and Sinks: 1990-2018. Annex 2 (Methodology for estimating CO2 emissions from fossil fuel combustion), Table A-28 for C coefficient and Table A-38 for heat content. https://www.epa.gov/sites/default/files/2021-04/documents/us-ghg-inventory-2021-annex-2-emissions-fossil-fuel-combustion.pdf: United States Environmental Protection Agency.

EPA. 2022. Greenhouse Gases Equivalencies Calculator – Calculations and References [Online]. https://www.epa.gov/energy/greenhouse-gases-equivalencies-calculator-calculations-and-references: United States Environmental Protection Agency. Available: https://www.epa.gov/energy/greenhouse-gases-equivalencies-calculator-calculations-and-references [Accessed 2023].

FRANCIS, M. 2018. About 7% of fossil fuels are consumed for non-combustion use in the United States [Online]. https://www.eia.gov/todayinenergy/detail.php?id=35672: EIA – U:S Energy Information Administration. Available: https://www.eia.gov/todayinenergy/detail.php?id=35672 [Accessed 2022].

GORDON, D. & FELDMAN, J. 2016. Breaking Down the Barrel: Tracing GH Emissions Through the Oil Supply Chain [Online]. Carnegie: Endowment For International Peace. Available: https://carnegieendowment.org/2016/02/09/breaking-down-barrel-tracing-ghg-emissions-through-oil-supply-chain-pub-62722 [Accessed 6th March 2021].

KONKRAFT 2020. The Energy Industry of Tomorrow on the Norwegian Continental Shelf: Climate Strategy Towards 2030 and 2050. KonKraft.

KONKRAFT 2022. The Energy Industry of Tomorrow on the NCS – Climate Strategy towards 2030 and 2050 – Status Report 2022. https://offshorenorge.no/contentassets/bf5d0058dbdd414781612ab1bbb2f680/eng_klimarapport-ver020822-v2.pdf: Offshore Norway.

NBIM. 2023. The fund [Online]. https://www.nbim.no/en/: Norges Bank Investment Management.  [Accessed 2023].

NPD 2023. The Shelf 2022. https://www.npd.no/globalassets/1-npd/publikasjoner/sokkelaret/sokkelaret-2022/the-shelf-2022.pdf: Norwegian Petroleum Directorate.

OCI. 2016. Mapping Oil´s Emissions [Online]. http://oci.carnegieendowment.org/#map: Carnegie Endowment for International Peace.  [Accessed 2022].

STATISTICS NORWAY. 2022. Emissions to Air 2022 [Online]. https://www.ssb.no/en/natur-og-miljo/forurensning-og-klima/statistikk/utslipp-til-luft: Statistics Norway.  [Accessed 2022].

TAKLE, M. 2020. Takle Environmental Values 2020.

VANDENBUSSCHE, V. & RAMBACH, E. 2019. Use of Oil and Gas Products in the Industry – Report for the Norwegian Oil and Gas Association. endrava.

VIKINGSTAD, J. 2022. Ti på olje- og gasstoppen. Stavanger Aftenbladhttps://www.aftenbladet.no/okonomi/i/abOmQE/ti-paa-olje-og-gasstoppen

10 reasons dissected

E24´s article from September 2021, prior to the Norwegian General election, on “Ten reasons why Norwegian oil and gas activity remain important” (see https://e24.no/olje-og-energi/i/RrmbbJ/ti-grunner-til-at-norsk-olje-og-gassaktivitet-forblir-viktig) is a good example of the oil and gas sector´s attempt to control the narrative in relation to the Petroleum-Industrial Complex. The article was written by the former CEO of Lundin Energy Norway, Kristin Færøvik and the current CEO of Petoro AS, Kristin Kragseth. This article requires a little in-depth analysis from a climate change perspective.

As an opinion piece, it tries to justify why continued oil and gas production is important, however the views and facts presented do not, in my opinion, reflect reality and are classic attempt to detract and deflect from taking real action on climate change, in particular reducing GHG emissions resulting from the combustion of oil and gas.

Lamb et al. (2020) is a great starting point to analyse the article: (https://www.cambridge.org/core/journals/global-sustainability/article/discourses-of-climate-delay/7B11B722E3E3454BB6212378E32985A7#

The paper describes the various tactics, which have previously been used to delay real action on climate change by creating doubt, uncertainty and fear in the mind of the reader. And in doing so, create inertia against changes that will reduce society’s addiction to oil & gas. Below is an analysis of the “Ten reasons…” mapped against the Lamb et al. (2020) climate discourses. The analysis for each of the ten reasons are are arranged as follows:

#Reason
Text from original article translated in to English
Assessment of the presented reason using Lamb et al. (2020)
Rebuttal / comment to the original and references used in the rebuttal / comment
Guide

1. The world needs energy

Reliable and sustainable energy at an affordable price is one of the UN’s 17 sustainability goals. This goal is also important in order to achieve several of the other goals, such as eradication of poverty, eradication of hunger, good health care and good educational institutions. In all scenarios outlined up to 2050, oil and gas make up a significant share of the energy mix. The market demands oil and gas.
> Fossil fuel solutionism
> Disruptive change is not necessary: push non-transformative solutions
This reason is very selective when referencing the UN´s 17 sustainability goals (SDG). It refers to affordable price whilst SDG 7 refers to Affordable and Clean Energy. The clean part is not mentioned – selective use. Interestingly SDG 13: Climate Action, SDG 14: Life Below Water, SDG 15: Life on Land and SDG16: Peace, Justice and Strong institutions are not metioned.  All of which are impacted by climate change caused by GHG emissions from the use of oil and gas.  The statement “All scenarios outlined up to 2050…” does not reference which scenarios it is referring to. For example, the recent IEA Net Zero Scenario released in May, clearly states that no further investment in oil and gas should take place if the goal of Net Zero is be reached in 2020. Again selective use however many of the IEAs other scenarios such as “”Stated Policies”” and “”Sustainable Development”” do forecast demand up to 2050 .”

2. 200,000 jobs

Employment is probably the most important single element in creating and maintaining good and well-functioning local communities. If we add up the number of jobs in the oil industry with everyone who delivers goods and services to the oil industry, it amounts to around 200,000 jobs. These jobs are distributed throughout the country.
> Appeal to social justice
> Change will be disruptive: emphasise the downsides
This is a factual statement based on an SSB report issued in 2017. However, in the context of this article no reference is made of energy transition related “green shift jobs” despite recent government white papers (Energy for Work – Long-term value creation from Norwegian energy sources or the Climate Plan 2021 – 2030). This is “Project Fear” approach to the local communities that currently have large employment in the oil and gas sector.

3. Huge income for the community

The petroleum resources on the Norwegian shelf belong to us all. Therefore, the tax system is set up so that most of the profits go to the state. In the revised national budget 2021, the state’s total revenues from the petroleum activities are estimated at NOK 154 billion. This corresponds to more than the defense and transport budget combined.
> Appeal to well-being
> Change will be disruptive: emphasise the downsides
This is a factual statement highlighting the huge tax revenues generated from petroleum related activities. However, it does not provide any further context such as it representing 14% of GDP and 14% of State revenues over the 2021 fiscal year. That means 86% comes from other sources. This is “”Project Fear”” to highlight what could be lost revenue if oil and gas revenues stop. This will not happen overnight and it is worth mentioning that these revenues will decline “”naturally”” as production in Norway goes into decline from 2030 onwards. Hence the importance of an early transition. Another recent report from SSB highlights 3 alternative scenarios, one of which is looking for a middle road of declining oil and gas production coupled to increased investment in alternatives. This is not mentioned here.”

4. Less production in Norway does not reduce greenhouse gas emissions

Some believe that if we reduce production from the Norwegian continental shelf, it will result in lower greenhouse gas emissions globally. But other manufacturers are queuing up to deliver. Common to these is that they have significantly larger emissions than we have from Norwegian production. A brake in Norway can therefore lead to an increase in emissions.
> Whataboutism
> Someone else should take action first: redirect responsibility
This statement is based on a recent Rystad Energy report sponsored by the Norwegian Oil and Gas Association (NOGA). This report has not been made publically available with only a “key findings” of the report issued on the NOGA web page. It highlights the impact of carbon leakage should oil and gas production be cut i.e. government policies to reduce supply to the market. Unfortunately, the methods and assumptions used by Rystad Energy cannot be independently verified. 

Without openness and transparency, it is hard to assess the merits of this reason. However it does introduce the issue of demand-side versus supply side policies, one of which is to restrict/stop exploration (For an overview see LAZARUS, M. & VAN ASSELT, H. 2018. Fossil fuel supply and climate policy: exploring the road less taken. Climatic Change, 150, 1-13.)

5. Continued exploration will slow down the downturn that comes

Production from the Norwegian continental shelf will decline after 2025. We have too few new discoveries and potential developments to prevent it. Exploration activity in the coming years will at best help to limit the decline. Continued exploration will prevent the loss of jobs and skills. In addition, it makes sense to utilize the infrastructure we already have in the form of platforms and export pipelines.
> Appeal to well-being
> Change will be disruptive: emphasise the downsides
It is factual that oil and gas production will decline after 2025 as many of the large fields come off plateau and go into decline and smaller fields enter tail-end production. This occurs in all oil and gas producing nations, it is a finite resource. However in the context of this article, this reason is again pushing Project Fear – loss of jobs and skills.  It ignores the IEA´s Net Zero scenario that no further investment is required if the goal of net zero in 2050 is to be achieved. It is a good example of trying to postpone the transition to green shift jobs by creating a sense of fear around present day jobs.  The argument given on infrastructure is classic “”carbon lock-in””. An investment has been made so use the petroleum related facilities. Seto et al., (2016) present strong arguments highlighting how a strong oil and gas lobby linked to political and institutional behaviours reinforces carbon lock-in. The challenge remains that some near-field exploration may be beneficial due to the high value generated but this reason is trying to polarise the argument. Are you for or against new exploration? There are many areas to be addressed when it comes to reducing/stopping exploration. This reason does not explore them and looks at business as usual.”

6. Petroleum is used for more than transport

About 55% of the oil and gas produced is used for transport. The rest are, for example, input factors for the chemical and pharmaceutical industry, and for plastics and other products we do not have good substitutes for today. Petroleum products are absolutely necessary in the production of wind turbines, electric cars, mobile phones and many other products we all depend on every day.
> Fossil fuel solutionism
> Disruptive change is not necessary: push non-transformative solutions
It is worth noting that no reference or source is quoted. It is not clear why only the transport sector is singled out.  According to the IEA, in 2018, oil and gas represent 54.4% of global energy supply while according to Our World in Data,  oil and gas account for 57.4% of global primary energy consumption by source. According to a recent Konkraft Report, 90% of oil and gas is combusted and the remaining 10% is used in the chemical and pharmaceutical industry. The transport sector may represent the main use of oil and gas but this point is misleading as a further ca. 35% oil and gas prodiced is still combusted mostly for  power generation and hence the reason presented is selective in what data is being presented to the reader. “

7. New technology springs from the petroleum industry

New technology will be important for us to be able to reduce greenhouse gas emissions and achieve the goals in the Paris Agreement. The petroleum industry in Norway is a locomotive in this area. We have the competence to develop, and the capacity to implement. Just look at projects in carbon capture and storage, the development of hydrogen and fuel cell technologies and the development of new renewable energy production such as offshore wind, to name a few examples.
> Technological optimism
> Disruptive change is not necessary: push non-transformative solutions
“Without doubt, the longer it takes to reduce emissions coming from oil and gas combustion, the more reliant the world becomes on technology driven solutions related to carbon dioxide removal (CDR) technologies such as carbon capture and storage (CCS). Yes, the oil and gas industry is a leader in technology development chiefly around reducing costs and maximising production, CCS is not new and was pioneered by the oil and gas sector in Norway to allow production from the Sleipner field where the gas has a high concentration of CO2, later followed by the Snøhvit field. The claim to develop new renewable energy production such as offshore wind is misleading. Fixed bottom offshore wind is an established technology, the technology being developed is floating offshore wind where oil and gas companies can use their expertise and competence. By not being specific on this point, it gives a false impression to the reader.  The technology for CO2 storage is well developed, the focus is now on the capture from large uses and transport to the storage site. Hence the Longship initiative in Norway. However, the technology is currently small-scale and needs to be massively scaled up if it is to have any impact. The real danger is that promotinon of this technology is a smokescreen for continued oil and gas production. Continued production can be maintained as there will be “”magic”” solution in the future. Oil and gas companies promoting CCS are perpetuating carbon lock-in i.e. the poacher is trying to become the game keeper.”

8. Oil companies are drivers of green investments

Many of the new renewable projects are driven by the traditional oil companies. As developers or on the investment side. Thus, revenues from oil and gas directly contribute to financing renewable energy. When someone talks about ” rather using the money we invest in oil and gas to invest in renewable energy and green jobs “, this is challenging. Stopping investment in oil and gas releases nothing. On the contrary, it will reduce companies’ ability to invest in renewable energy. 
> Fossil fuel solutionism
> Disruptive change is not necessary: push non-transformative solutions
This is redefining “green finance” in a new way. Rebranding of oil and gas companies as energy companies coupled with pressure from investors and society in general has forced oil and gas companies to diversify into renewables. However, the majority of investment is still into new oil and gas projects. Oil and gas companies are dependent on the cashflow generated by their oil and gas revenues to invest in their renewable projects. Many renewable companies has access to capital from major financial institutions and not reliant on the production of oil and gas. 

Again another selective argument to justify continued oil and gas production for said companies to have cashflow to invest in renewables. Reference Equinor´s 2021 capital market update where renewables only account for 12% of the total capital expenditure in 2021.  On the positive side Equinor´s ambition is >50% in 2030. There is some gap to close between now and 2030 and that’s a lot of money going into oil and gas in the next 10 years .

It is worth noting that neither Lundin Energy or Petoro are direct investors in renewable projects.

9. Norwegian petroleum contributes to geopolitical stability

Most of the world’s oil and gas resources are controlled by countries without democratic governance. And they have enough production capacity to replace Norwegian oil and gas almost immediately. By moving production from Norway to these countries, we give more power and influence to non-democratic countries. Norwegian gas currently covers 22% of Europe’s total demand.
> Appeal to well being
> Change will be disruptive: emphasise the downsides
“This reason is wrong on two accounts. Firstly, the aim of the energy transition is to move away from fossil fuels (oil and gas) and towards renewables. The quicker this transition takes place, the quicker the reliance on “”countires without democratic governance”” is reduced. Secondly, it avoids teh biggest elephant in the room, climate change through driven by continued GHG emissions will lead to greater geopolitical instability. Natural disasters, mass migration and economic turmoil in petrostates will lead to greater instability. Hence this reason is wrong and is again based on Project Fear.”

10. Demand for expertise throughout the world

Norway is in the world elite when it comes to products, technologies, expertise and safety for the petroleum industry. The Norwegian petroleum-related supplier industry accounts for an export value of about 120 billion a year, and is Norway’s second largest export industry after sales of oil and gas. Many of these companies are now also aiming for the international renewable market. The supplier industry is at the top of the world because we have a solid domestic market as a foundation. If this deteriorates, it will affect exports.
> Appeal to social justice
> Change will be disruptive: emphasise the downsides
“Project fear around jobs. This is why the green shift has to take place as soon as possible to enable suppliers to transition to the growing renewables market. If correctly supported by government then a transition maintaining skills and competence can be managed. The real danager is that clinging to oil and gas will prevent these skills from developing and other countries develop a more competitive base.  It is worth noting that Norway has still not issued any licences for offshore wind farms. Earliest is planned for 2022. Compared to other countires it is very late to the game. Perhaps any over reliance on oil and gas and lack of political will to diversify from oil and gas are explnantions for this. This is Project Fear attempting to justify continued use of oil and gas production because it maintains the supply industry and allowing it to diversify into renewables.”

Summary

The “Ten reasons” article, in the opinion of the author, are a classic example of climate discourse promoted by the oil & gas sector in Norway. The article was written in the run-up to the Norwegian general election in September 2021, and used to counter arguments presented by the Green Party against the oil & gas industry. The oil & gas sector is desperate to control the narrative to maintain the status quo, promote continued exploration and production to avoid the need for supply side policies.

The current energy crises in Europe, created by the Russo-Ukrainian war, is used by the oil & gas sector to further promote business-as-usual. The energy crises is real but the need for further exploration is questionable given, on average, it takes 7 to 10 years from licence award, discovery and development to get to first production. This will not help the immediate crises and by the time such fields are producing, the world needs to have moved on to renewables if the goal of net zero are to be met.

To surmise, I believe the article is a poor and un-informed attempt to justify maintaining the status quo / business-as-usual for oil & gas in Norway.