Stavanger Aftenblad recently published an article titled “Ten on top – The shelf´s biggest producers” (Vikingstad, 2022). The focus of the article was to highlight the top ten oil and gas producers in Norway for 2022 with no other reason than that. There was no mention of the climate crises or how the combustion of these produced volumes will contribute to it.
Therefore, I thought it would be fun to add a climate change context and re-classify these as the top ten contributors to greenhouse gas (GHG) emissions created by the combustion of the oil and gas they produce. These emissions are classified as Scope 3 and this is something the petroleum industry and government in Norway turn a blind eye to. Primarily because the oil and gas is exported and not part of the GHG emissions reported by Norway. Norway promotes itself as a “low carbon intensity” oil and gas producer focusing on Scope 1 and 2 emissions only and is a blatant smoke screen to justify continued production. The Norwegian Oil & Gas Association, renamed to Offshore Norge to greenwash its role in promoting continued oil and gas production, proudly emphasises this point with no mention of Scope 3 emissions (KonKraft, 2022).
The main narratives by the petroleum industry and their supporters in Norway are:
- Wealth creation for Norway,
- Oil and gas jobs and ripple effects, and
- Energy security,
The primary focus is to reduce Scope 1 and Scope 2 emissions to help Norway achieve its climate goals by reducing emissions related to extraction whilst the rest the world can pick up the cost for the Scope 3 emissions. That is not Norway´s problem.
Not all oil and gas that is produced and sold to the internal market is combusted, some is used to make plastics, fertilisers and other items. This ranges from 7 to 10% so let’s be generous and say that only 90% of produced oil and gas is combusted (Francis, 2018, KonKraft, 2020, Vandenbussche and Rambach, 2019). So how much carbon comes from combusting a barrel of oil or barrel of oil & gas equivalent (boe) for gas.
The average carbon dioxide coefficient of distillate fuel oil is 431.87 kg CO2 per 42-gallon barrel (EPA, 2022). The average carbon dioxide coefficient of liquefied petroleum gases is 235.7 kg CO2 per 42-gallon barrel (EPA, 2021).
If the GHG emissions are tracked through the oil supply chain of up- mid- and downstream, these values are proposed by Gordon and Feldman (2016).
| Oil type | Total GHG Emissions (kg CO2eq./barrel crude) |
| Conventional light oil | 475 |
| Depleted oil | 715 |
| Light, gassy oil | 750 |
| Extra heavy oil | 770 |
Alternatively, the OCI (2016) also provides Norway specific values.
| Field | GHG Emissions (kg CO2eq./barrel crude) |
| Skarv | 487 |
| Oseberg | 527 |
| Ekofisk | 481 |
To keep the maths simple let´s assume an average barrel of oil produced in Norway produces a total of 500 Kg CO2eq. / boe. This may be a gross assumption as a lot of gas is produced by Norway however it has been converted into boe. The calculation does not take into consideration Scope 1 2021 (Statistics Norway, 2022)
So let´s do the maths and determine the Scope 3 emissions Norway´s top oil and gas are responsible for:
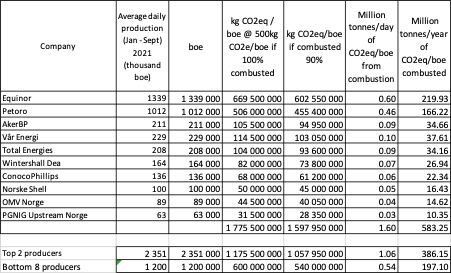
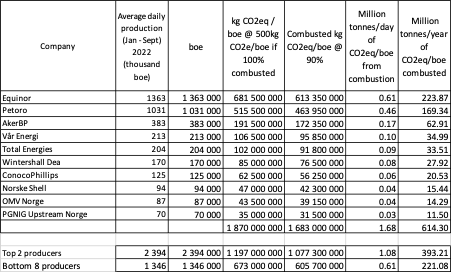
It is interesting to observe that Equinor and Petoro owned by the Norwegian State at 78% and 100% respectively, account for close to double the emissions of the other top 8 companies combined. That means the Norwegian Government is responsible for the majority of Scope 3 emissions coming from the oil and gas produced and exported from the Norwegian Continental Shelf. Yet the same government promotes itself, rather hypocritically, as a leader on climate change by conveniently ignoring the scope 3 emissions. Why? Because it is in the thrall of the oil and gas lobby and who have convinced the government that it needs the tax revenues to balance the books with the mantras of value creation, jobs and energy security. Why kill the goose that lays the golden egg when scope 3 emissions are not Norway´s problem.
Norway emitted 48.9 million tonnes of CO2eq. in 2021 (Statistics Norway, 2022) of which 12.1 million related to oil and gas extraction. That means that Norway exported close to 11.9 times its own GHG emissions in 2021. The increase in production in 2022 driven by the war in Ukraine shows this increased to 12.5 times its own GHG emissions assuming the same level of national emissions in 2022. Norway would have a real problem if it needed to deal with the Scope 3 emissions it is contributing towards. Why is this ignored?
The Government Pension Fund of Norway, specifically the “The Government Pension Fund Global” also known as the “Oil Fund”, is worth some USD 1.3 trillion (end 2022 estimate) (NBIM, 2023).
The Oil Fund proudly claims “We work to safeguard and build financial wealth for future generations”. By future generations, I assume Norwegian ones, and as such, this is a big snub to put it lightly to all future generations in the global south who will suffer the most due to the impact of climate change! Yet ironically the Oil Fund itself no longer invest in oil and gas due to the detrimental impact of its activities (Arvin, 2021).
Despite this moratorium, the Norwegian government through the Ministry of Petroleum & Energy and the Norwegian Petroleum Directorate continue to push, promote and subsidise oil & gas production on the NCS to secure wealth for Norway at the expense of the rest of the world (NPD, 2023). It is hard to stop when you are addicted to something even when you have so much money available to transition away from oil and gas quicker than nations that don´t have such wealth. Takle (2020) highlights how the oil fund has migrated to represent value generation for Norway without consideration to the environmental consequences, and how this will impact the “wealth” of future generations. This is especially relevant as that future will be pretty bleak if global emissions of GHG are not significantly reduced as soon as possible.
This is a moral and ethical question more than anything else but is Norway ready to look itself in the mirror and ask it!
References
ARVIN, J. 2021. Norway’s trillion-dollar wealth fund sold the last of its investments in fossil fuel companies. VOX [Online]. Available: https://www.vox.com/22256192/norway-oil-gas-investments-fossil-fuel [Accessed 20th May 2021].
EPA 2021. Inventory of U.S. Greenhouse Gas Emissions and Sinks: 1990-2018. Annex 2 (Methodology for estimating CO2 emissions from fossil fuel combustion), Table A-28 for C coefficient and Table A-38 for heat content. https://www.epa.gov/sites/default/files/2021-04/documents/us-ghg-inventory-2021-annex-2-emissions-fossil-fuel-combustion.pdf: United States Environmental Protection Agency.
EPA. 2022. Greenhouse Gases Equivalencies Calculator – Calculations and References [Online]. https://www.epa.gov/energy/greenhouse-gases-equivalencies-calculator-calculations-and-references: United States Environmental Protection Agency. Available: https://www.epa.gov/energy/greenhouse-gases-equivalencies-calculator-calculations-and-references [Accessed 2023].
FRANCIS, M. 2018. About 7% of fossil fuels are consumed for non-combustion use in the United States [Online]. https://www.eia.gov/todayinenergy/detail.php?id=35672: EIA – U:S Energy Information Administration. Available: https://www.eia.gov/todayinenergy/detail.php?id=35672 [Accessed 2022].
GORDON, D. & FELDMAN, J. 2016. Breaking Down the Barrel: Tracing GH Emissions Through the Oil Supply Chain [Online]. Carnegie: Endowment For International Peace. Available: https://carnegieendowment.org/2016/02/09/breaking-down-barrel-tracing-ghg-emissions-through-oil-supply-chain-pub-62722 [Accessed 6th March 2021].
KONKRAFT 2020. The Energy Industry of Tomorrow on the Norwegian Continental Shelf: Climate Strategy Towards 2030 and 2050. KonKraft.
KONKRAFT 2022. The Energy Industry of Tomorrow on the NCS – Climate Strategy towards 2030 and 2050 – Status Report 2022. https://offshorenorge.no/contentassets/bf5d0058dbdd414781612ab1bbb2f680/eng_klimarapport-ver020822-v2.pdf: Offshore Norway.
NBIM. 2023. The fund [Online]. https://www.nbim.no/en/: Norges Bank Investment Management. [Accessed 2023].
NPD 2023. The Shelf 2022. https://www.npd.no/globalassets/1-npd/publikasjoner/sokkelaret/sokkelaret-2022/the-shelf-2022.pdf: Norwegian Petroleum Directorate.
OCI. 2016. Mapping Oil´s Emissions [Online]. http://oci.carnegieendowment.org/#map: Carnegie Endowment for International Peace. [Accessed 2022].
STATISTICS NORWAY. 2022. Emissions to Air 2022 [Online]. https://www.ssb.no/en/natur-og-miljo/forurensning-og-klima/statistikk/utslipp-til-luft: Statistics Norway. [Accessed 2022].
TAKLE, M. 2020. Takle Environmental Values 2020.
VANDENBUSSCHE, V. & RAMBACH, E. 2019. Use of Oil and Gas Products in the Industry – Report for the Norwegian Oil and Gas Association. endrava.
VIKINGSTAD, J. 2022. Ti på olje- og gasstoppen. Stavanger Aftenblad. https://www.aftenbladet.no/okonomi/i/abOmQE/ti-paa-olje-og-gasstoppen
